Our Project Methodology
This project’s main objective is to separate facts from fiction when it comes to actual Presidential records by looking directly at the data, starting from Truman in 1947 and ending with Obama in 2014. To that end we looked at the changes from the beginning of the two-year terms to the end of same term, for a variety of Economic Indicators including:
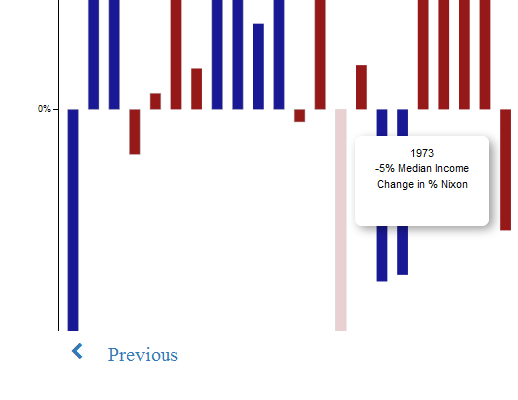
- Median Income Change
- GDP Change
- Consumer Price Index Change
- S&P500 Change
- Budget as of GDP
- Budget As Percentage Change
- Debt
- Unemployment Change
- Unemployment (As Percentage of Workforce)
The Two-Year Term was chosen because US Congress is on such an election cycle and the President works with legislature in order to pass laws that may have potential bearing on the economy. Our coordinated map view captures exactly that -- sometime Presidents work with opposition (say Eisenhower) and sometime they don’t (e.g. Truman) -- the assumption being, that it may be easier for the President that pass their economic agenda with a supporting Congress.
Change is more useful for comparison than nominal data -- meaning that if Median Income was down in the 1947 Truman’s term by 5% that
can be directly compared to Nixon’s 1973 term of 5% decline (in fact, it's the same)! We compare the start of the term to the start of the next one.
And, again, we’re looking and comparing only two-year terms! And even the notable exceptions of Kennedy and Nixon who didn’t complete their entire terms should not interfere too much with this line of reasoning as they were succeeded by presidents of the same party.
Finally, our project is intended for a visitor’s self-exploration and that’s why we chose not to include commentary and conclusions from the data -- we trust the user to be able to draw their own conclusions by observing the data visualizations. And, of course, there are a myriad other factors contributing to a President’s term in office on the economy and everything else -- we deliberately don’t claim any correlation or causality between the two. This is what, after all politicians would like us to believe or at least when the data is in their favor and vehemently oppose it when it’s not!